
Intro to Python Scripting: 15 Export Points to CSV
Course or Collection:
Tag:
Video Duration:
21 minutes
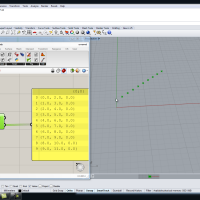
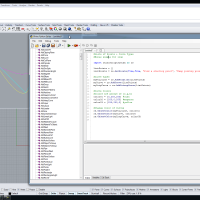
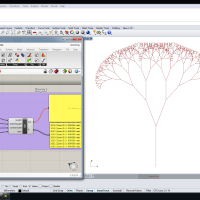
In this tutorial we look at how to export a set of points to the CSV file format so that we can view the data in Excel. We export X,Y,Z coordinate info from our points as well as their color values. I use the random point script from before to create 1000 points to export. We introduce a few new Rhinoscript methods rs.PointCoordinates and rs.SaveFileName. We also look at thepython open() and close() methods for file I/O.
#Export Points to CSV

import rhinoscriptsyntax as rs

#Select our points
pts = rs.GetObjects("Select Points for CSV Export", 1)

#create a filename variable
filename = rs.SaveFileName("Save CSV file","*.csv||", None, "ptExport", "csv")

#open the file for writing
file = open(filename, 'w')

#create and write a headerline for our CSV
headerline = "X,Y,Z,R,G,B\n"
file.write(headerline)

#print pts
for pt in pts:
    ptCoord = rs.PointCoordinates(pt)
    x = ptCoord[0]
    y = ptCoord[1]
    z = ptCoord[2]
    color = rs.ObjectColor(pt)
    print color
    r = color.R
    g = color.G
    b = color.B
    print "x: %.4f, y: %.4f, z: %.4f, r: %d, g: %d, b: %d" %(x,y,z,r,g,b)
    line = "%.4f,%.4f,%.4f,%d,%d,%d \n" %(x,y,z,r,g,b)
    file.write(line)

#Close the file after writing!
file.close()
Related Content
Want to Contribute?
Want to be an author? Drop us a line here we'd love to have you.
Already have a video you'd like to post? Send us a link and we'll get you going.
:)
Comments
miledrizk replied on Permalink